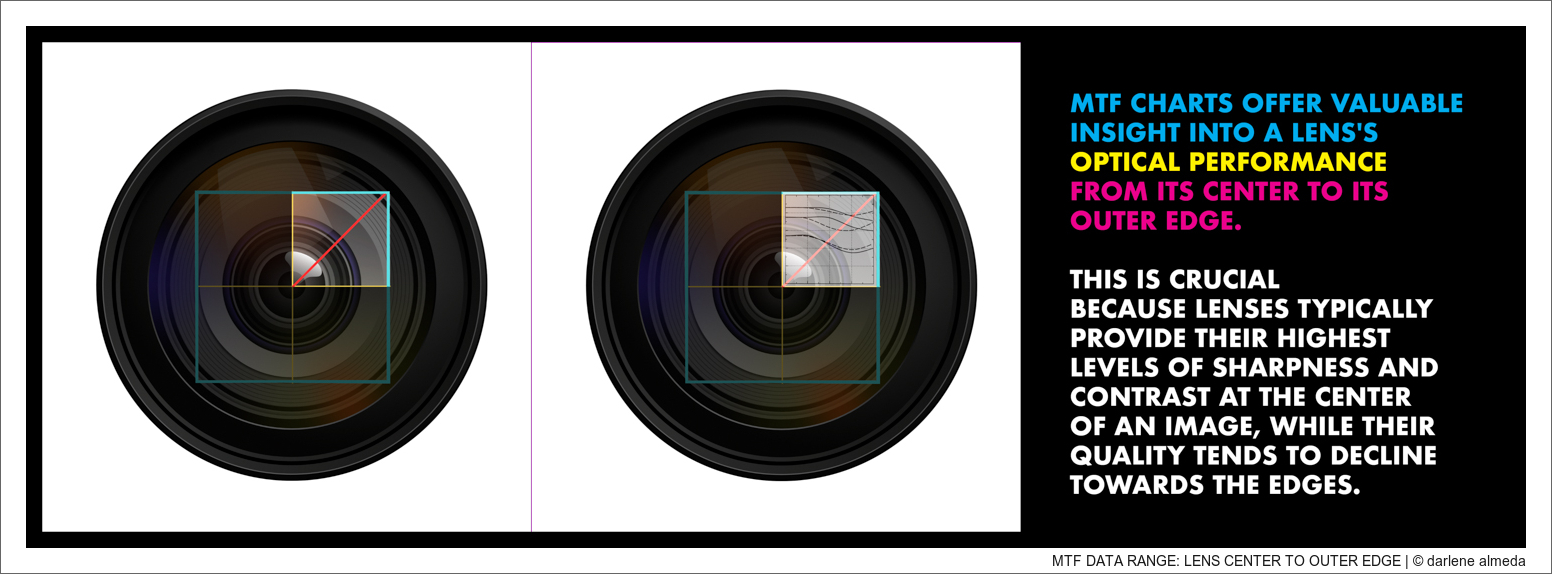
[ MTF DATA RANGE: LENS CENTER TO OUTER EDGE ]
Modulation Transfer Function (MTF) is a term used to describe how well a lens can capture and reproduce the details of an object. Imagine you’re trying to take a photo of a very intricate painting. If your lens has a high MTF, it will capture all the tiny brushstrokes and details of the painting, resulting in a clear and sharp image. But if your lens has a low MTF, the image may appear fuzzy, and you won’t be able to see all the fine details of the painting.
This article explores the factors contributing to a high MTF. It offers guidance on how to read the MTF charts supplied by lens manufacturers, thus empowering you to gauge a lens’s performance based on its MTF, assuming all other factors are equal (the lens is not damaged, your subject is in perfect focus, etc.). Let’s begin by understanding the components of sharpness.
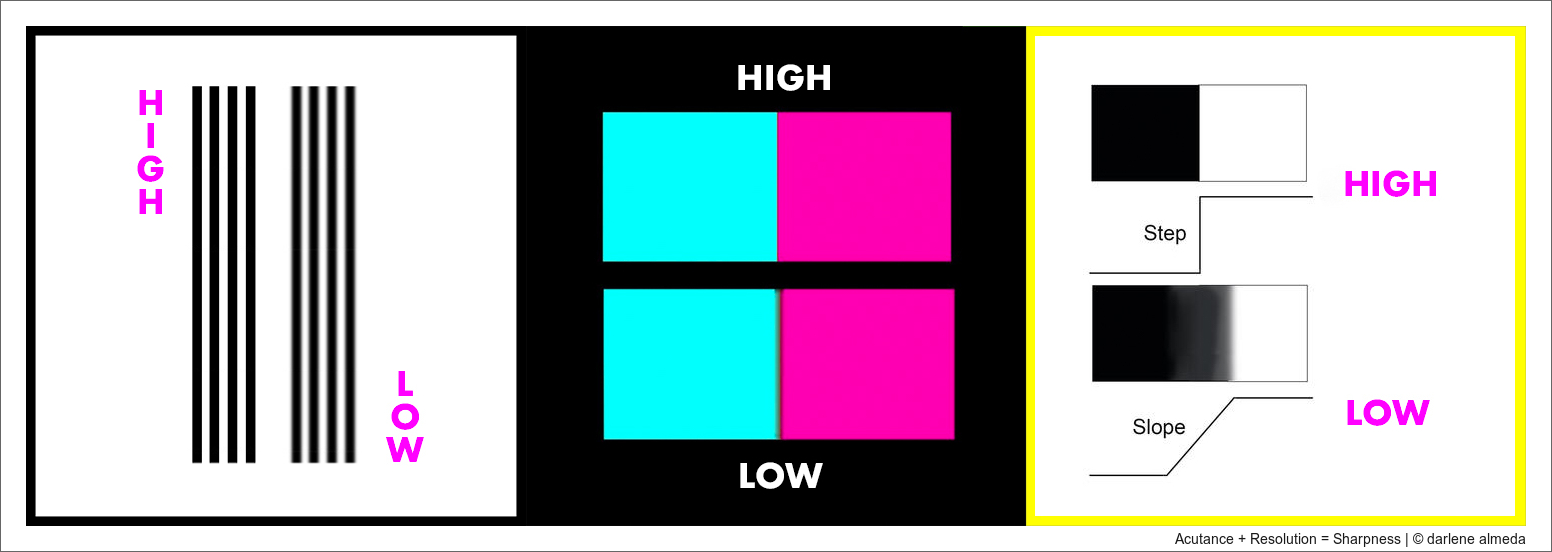
Acutance + Resolution = Sharpness
[ ACUTANCE + RESOLUTION = SHARPNESS ]
Look at the graphic above. The three illustrations show sharpness and non-sharpness in different ways but share high and low resolutions and high and low acutance.
The left-hand box, displaying a white background intersected by black bars, illustrates both high and low acutance. The initial set of bars, marked ‘HIGH,’ reveals a sharp transition from white to black, indicative of a superior-quality lens. In contrast, the second set of bars, labeled ‘LOW’ acutance, portrays a more gradual, blurred transition from white to black, signifying a lens of inferior quality. Within this latter group, should there be an effort to boost the resolution by introducing more bars to heighten acutance but still using the same lesser-quality lens, the extra bars would eventually blend into one another. With enough added bars, they would form a solid black rectangle. This scenario emphasizes that having high resolution (abundance of details) is not enough to guarantee a sharp image. If the lens lacks a high MTF value, the details will not be represented accurately and will appear fuzzy or smeared.
The center box illustrates how diminished acutance and resolution influence color, leading to a gradient-like blurring effect. The final graphic zeroes in on edge clarity, also called acutance. In these examples, we can see how the combination of acutance and resolution can sharpen an image.
A Good Starting Point
Before reading an MTF, it’s essential to recognize that these charts often come from the manufacturers as test results. Since they are both the creator and the vendor of the tested lens, they naturally aim to present the best possible outcomes. While MTF charts can offer valuable insights into a lens’s performance, they aren’t the definitive gauge of its quality. The real test comes from your personal evaluation of the lens you possess; the MTF serves as a helpful starting point.
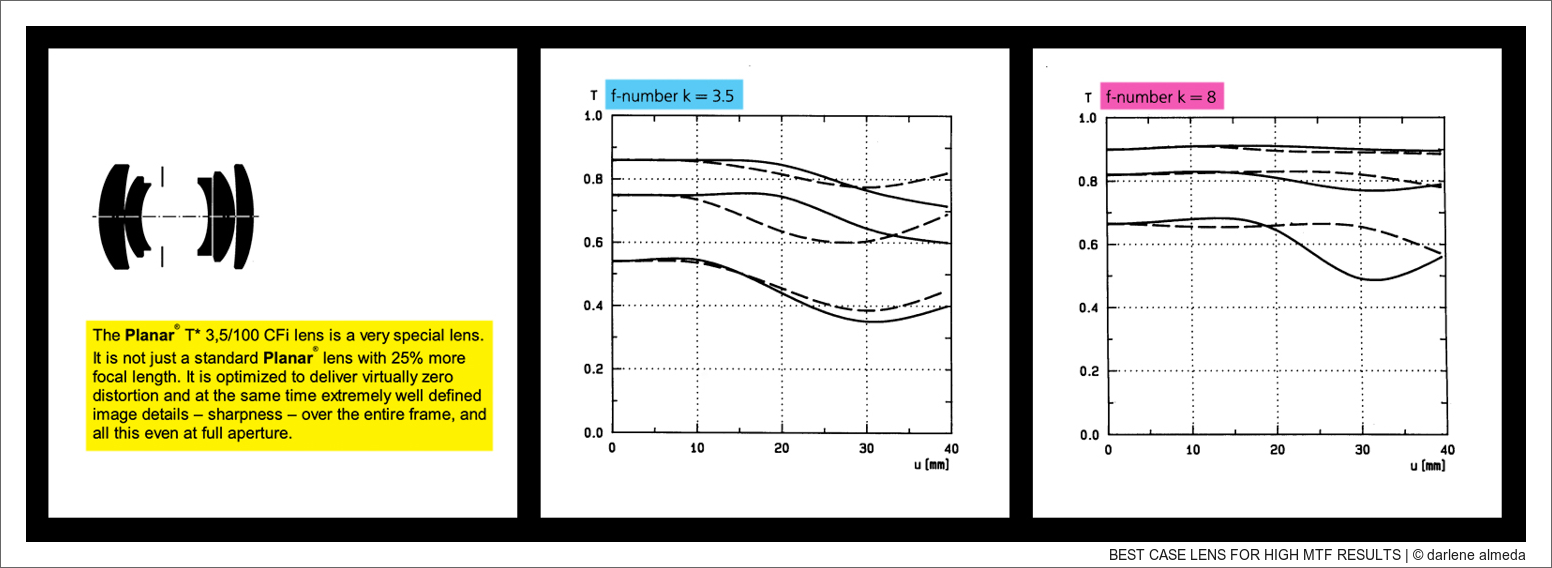
Let’s begin at the top, shall we? I find it instructive to start with a known high-quality lens, a favorite one, to learn how to decipher the information that an MTF can reveal. We will examine the MTF and lens description provided by Hasselblad for their CFi 100/3.5 Planar lens. If you have an MTF chart for a favorite lens, feel free to reference it as we explore mine.
[ IDEAL SITUATION: A SUPERIOR LENS BACKED BY IMPRESSIVE MTF PERFORMANCE ]
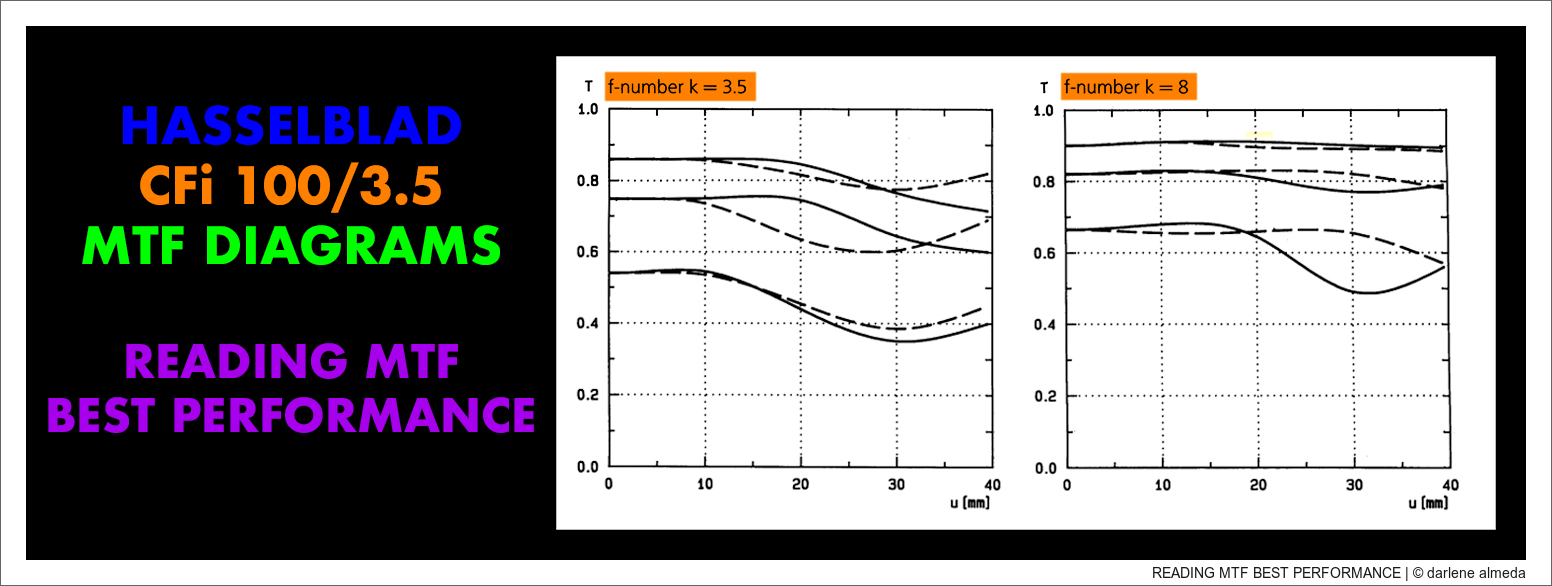
I will use the MTF example shown above for a popular Hasselblad lens. Per user feedback, the Hasselblad V lens, 100/3.5, is highly respected regarding sharpness and contrast. The data sheet for this lens is available for reference here. Hasselblad offers MTF charts for all its lenses, tested at the widest aperture and stopped down by around two aperture values.
Photographers have various requirements when it comes to shooting different apertures. Some must shoot under low light conditions and seek the best lens performance at wide-open apertures. In contrast, others may prefer larger apertures for specific lens effects, especially portrait photographers. On the other hand, landscape and product photographers demand optimal lens performance at smaller apertures. The practice of supplying MTF charts that show both wide-open and stopped-down measurement values can cater to the diverse requirements of various photographers.
The MTF diagrams we’ll examine showcase this lens’s performance at apertures of f/3.5 and f/8. MTF charts from different lens manufacturers might appear similar or vary in design. Some might use a two-color graphing scheme, eliminating the need for two charts. The key here isn’t the aesthetic choices of the graphs but the data they contain, provided that it’s presented clearly and easily interpretably. We will begin by learning the MTF chart components and how they are utilized.
The Solid & Dotted Lines
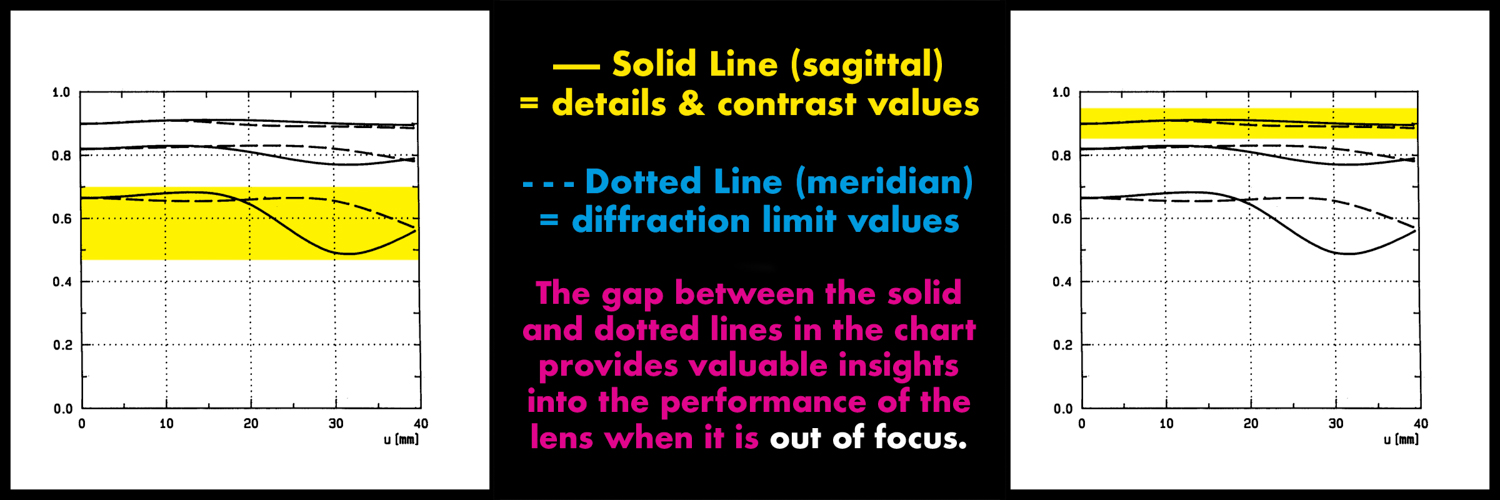
The solid lines on the MTF chart are called sagittal lines and illustrate the lens’s ability to reproduce details and contrast at different spatial frequencies. These frequencies are measured in line pairs per millimeter (lp/mm). In simple terms, the solid line shows how sharp and clear your images will be for various levels of detail.
The Dotted Line (Meridian)
The dotted lines on the MTF chart are called meridian lines and represent the diffraction limit, a fundamental limit set by the physics of light. They indicate what the quality of the out-of-focus areas of your image may be.
[ MTF LINES & GAPS ]
The Distance (Gap) Between Solid & Dotted Lines Matters
The performance of a lens in rendering out-of-focus areas can be assessed on an MTF diagram by observing the proximity between solid and dotted lines. When these lines are closely aligned, the lens excels in creating a smooth and pleasing soft focus, resulting in a favorable ‘bokeh’ effect.
If the lines are far apart and diverge, the unfocused parts of the image can look distorted and unattractive, with unappealing ‘bokeh.’ The distance between these lines is also linked to issues like flare, smear, and different types of distortion. The main point is that a desirable result is achieved when the lines are closely aligned.
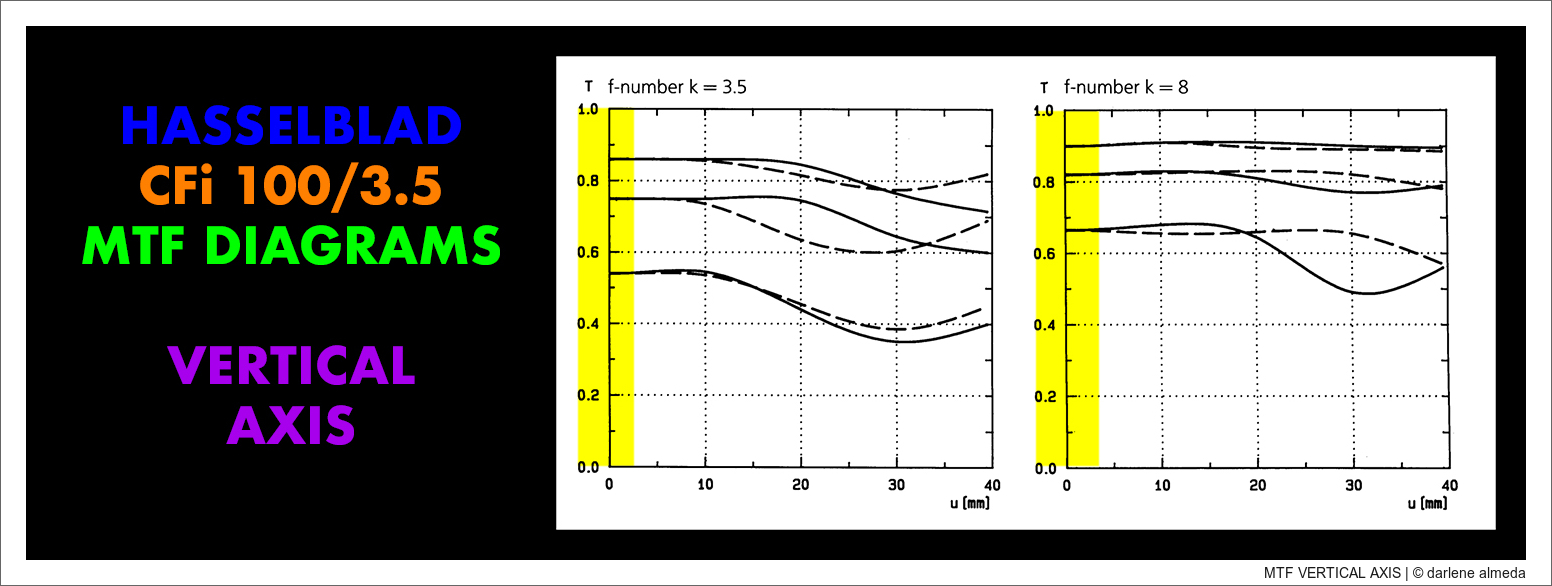
The Vertical Axis
[ MTF VERTICAL AXIS ]
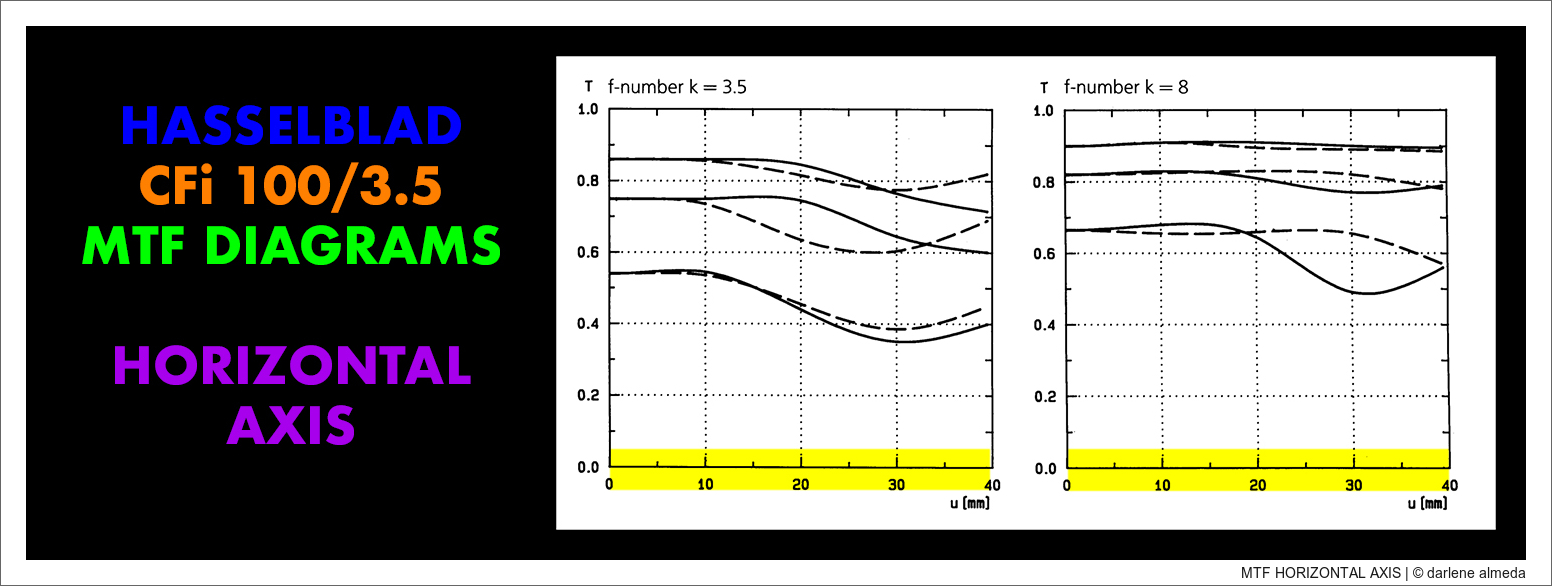
The Horizontal Axis
[ MTF HORIZONTAL AXIS ]
The center of the lens is on the left (0), with each verticle line representing 10 mm, so the far right is 40 mm from the center to the outer edge of the lens. The corners of the Hasselblad film frame 2.25 x 2.25 inches (6×6 cm) are at the 39 mm mark on the axis.
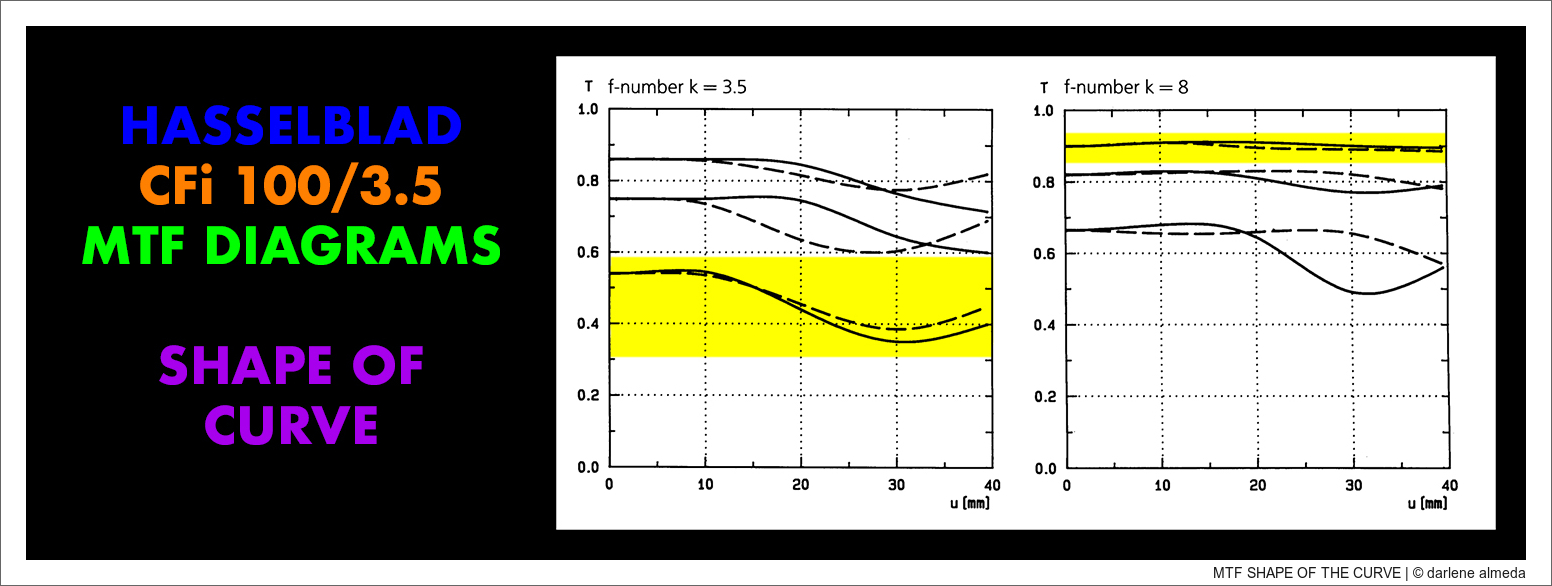
The Shape of the Curve
[ MTF SHAPE OF THE CURVE ]
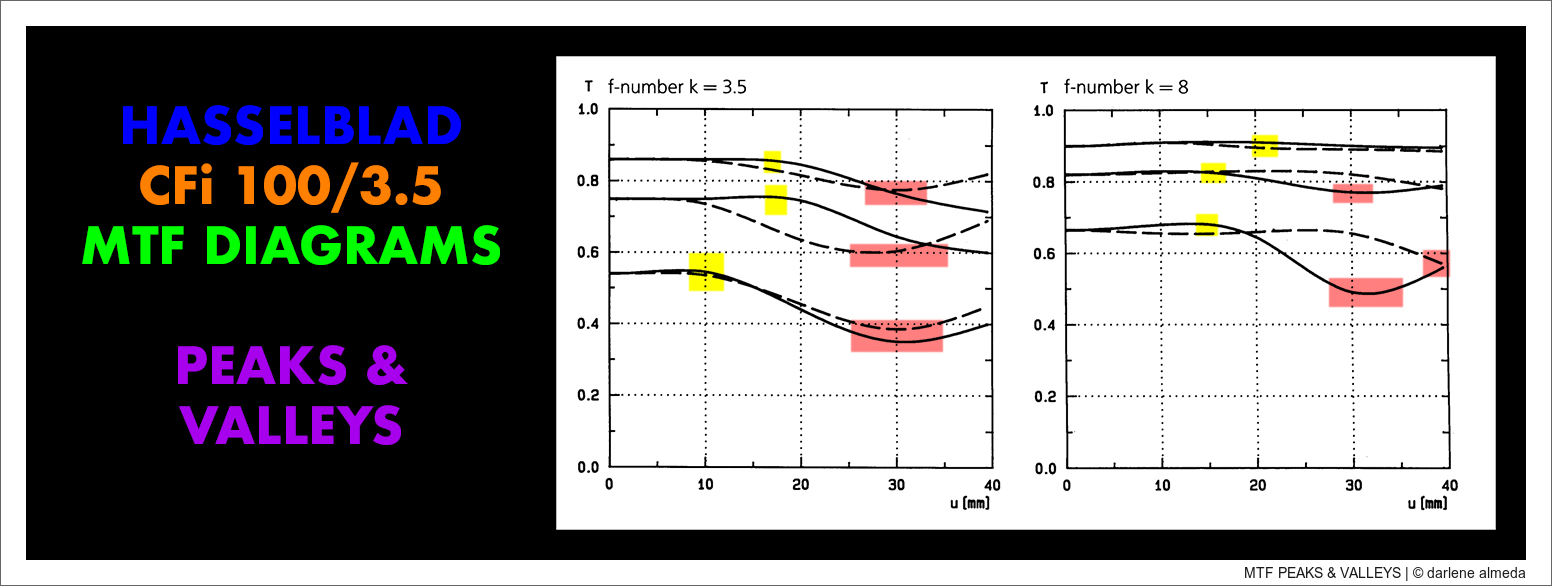
The Peaks and Valleys
[ MTF PEAKS & VALLEYS ]
Peak performance! When you see peaks in the curve, it signifies that the lens is performing exceptionally well at specific frequencies, preserving incredible sharpness and contrast. Conversely, valleys denote areas where the system struggles to retain detail, resulting in softer, less defined images.
Reading the MTF
[ READING MTF BEST PERFORMANCE ]
Evaluating Three Sets of Lines
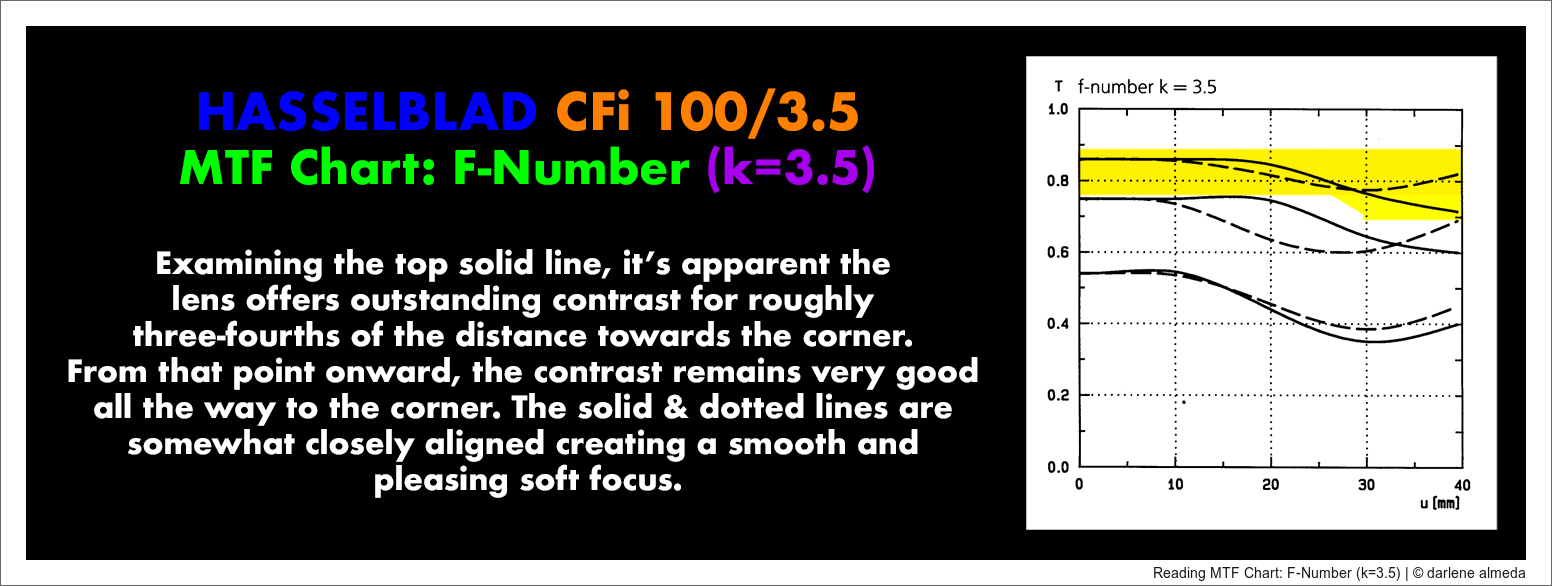
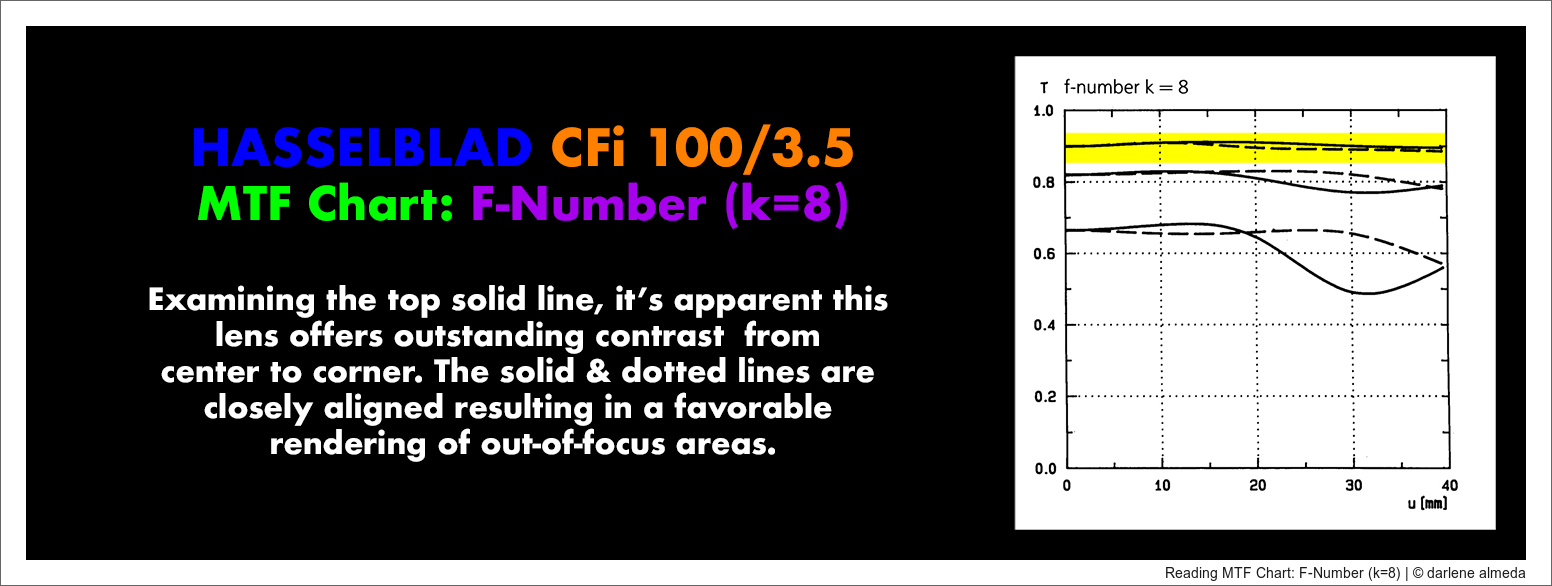
To evaluate the performance of this lens, we refer to the three sets of lines that represent different resolution figures in each diagram. The top line (or top two lines) is particularly significant for general photography. It is important to note that the higher the lines, the better the lens.
MTF line: at or over 0.8 = excellent; at or over 0.6 = good, and at or below 0.4 = not good
[ READING MTF CHART: f/3.5 ]
[ READING MTF CHART: f/8 ]
MTF Results Match User Experiences
Numerous users, including myself, have praised this lens throughout the years for meeting its MTF evaluations and consistently providing top-notch quality. By examining its MTF, we gained a visual insight into the high level of performance that the lens was engineered to achieve.
Real-World Application
Now, how does all of this knowledge come into play? Understanding MTF diagrams helps you make informed decisions when choosing lenses or assessing image quality. It guides you to select equipment that suits your specific needs, whether you aim for portraits with soft bokeh or landscapes with intricate details. After mastering the reading of MTF charts, I started using them to evaluate the lenses that caught my interest. I consider MTF charts as an additional tool in my toolbox, helpful when deciding whether to acquire a lens. I hope you’ll find them useful in your decision-making process as well.

